Constructing and Comparing Linear and Exponential Models
Two scientists are studying unknown bacteria. The first bacteria, named here Bacteria A, seems to be doubling it's quantity every minute. It started off with 2 bacteria. The second bacteria, named Bacteria B, is being increased by 2 for every minute that passes. It also started off with 2 bacteria. Make a sequence for these two bacteria quantities, and compare them.
Bacteria A: 2, 4, 8, 16, 32, 64...
Bacteria B: 2, 4, 6, 8, 10, 12...
Bacteria B: 2, 4, 6, 8, 10, 12...
For starters, they both start with 2 bacteria. However, they do not increase the same way. Bacteria A doubles as minutes pass, while Bacteria B simply adds 2 for each passing minute. With this information, we know that Bacteria A represents an exponential function, while Bacteria B represents a linear function.
-Explain and compare the increasing tactics.
Bacteria A has a constant percent rate per unit of +2, while Bacteria B has a constant rate of +2. Since Bacteria A is doubling, it is exponentially increasing. Bacteria A is increasing at a CONSTANT RATE, so it represents a linear function.
*Constant Percent Rate Per Unit is for describing an exponential function, while Constant Rate is for describing a linear function.
-Graph both models.
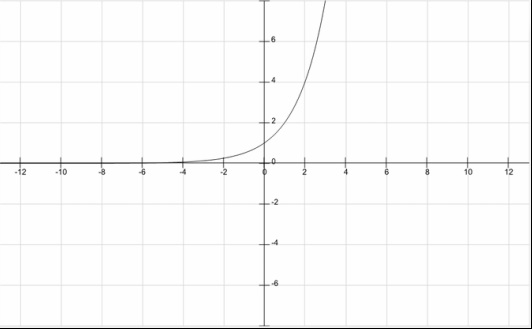
y=2^x
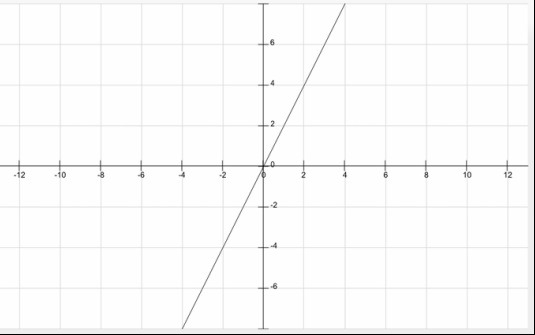
y=2x
